Debugging embedded systems can be a complex and time-consuming process. With hardware and software tightly integrated, issues can arise from various sources. A structured approach to debugging can help identify and resolve problems efficiently. This guide outlines key steps to troubleshoot and debug embedded systems effectively.
Understanding Common Embedded System Issues
Before starting the debugging process, it’s essential to understand the typical issues that arise in embedded systems:
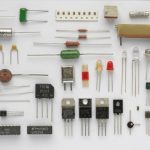
- Hardware Faults – Issues with power supply, clock signals, or component failures.
- Firmware Bugs – Errors in the software code causing unexpected behavior.
- Communication Failures – Problems with protocols like UART, SPI, I2C, or CAN.
- Memory Corruption – Stack overflows, memory leaks, or incorrect pointer usage.
- Timing Issues – Race conditions, improper interrupt handling, or synchronization errors.
Step-by-Step Debugging Process
1. Define the Problem Clearly
- Gather detailed information about the issue.
- Replicate the problem consistently.
- Document system behavior, error messages, and test cases.
2. Check Power and Clock Signals
- Verify power supply voltages and connections.
- Check if clock signals are stable and within the expected range.
- Ensure the microcontroller is properly reset after power-up.
3. Use Debugging Tools
- JTAG/SWD Debuggers – Step through code execution and set breakpoints.
- Oscilloscopes & Logic Analyzers – Monitor signal integrity and timing.
- Serial Print Debugging – Use UART or USB logs for real-time feedback.
- Memory Watch & Profiling Tools – Detect memory leaks and performance bottlenecks.
4. Validate Software and Firmware
- Review code for logical errors and incorrect configurations.
- Check firmware version compatibility with hardware.
- Test individual software modules before integrating.
- Use assertions and error-handling mechanisms to catch unexpected states.
5. Verify Communication Interfaces
- Confirm correct wiring and connections.
- Use a protocol analyzer to capture and inspect communication data.
- Check for incorrect baud rates, parity settings, or address mismatches.
6. Monitor Memory Usage
- Identify stack overflows using stack analysis tools.
- Use dynamic memory analysis to detect leaks or corruption.
- Optimize memory allocation to prevent fragmentation.
7. Analyze Timing and Interrupts
- Ensure correct priority assignment for interrupts.
- Check for excessive interrupt latency.
- Use event logging to track real-time execution.
8. Test Under Different Conditions
- Run stress tests with varying loads and inputs.
- Simulate extreme conditions like temperature variations and power fluctuations.
- Use hardware-in-the-loop (HIL) testing for real-time system validation.
9. Check for External Interference
- Identify potential EMI/EMC issues.
- Shield critical components from noise.
- Use proper grounding techniques to reduce interference.
10. Keep a Debugging Log
- Maintain detailed logs of observed issues and solutions.
- Create a knowledge base to speed up future debugging efforts.
- Regularly update documentation with fixes and lessons learned.
Conclusion
Debugging embedded systems requires a systematic approach, combining hardware and software analysis. By following structured debugging steps, engineers can efficiently identify and resolve issues, ensuring reliable and robust system performance. A proactive approach to debugging not only saves time but also improves the overall design process.